Territory Visualization
Plan The Profitable Expansion Of Your Franchise
Identify New Target Locations Faster.
Forecast Success Of New Locations.
Reduce Territory Encroachment.
Produce A Visual Sales AID.
CLOSE MORE FRANCHISE DEALS WITH MAPS.
Many franchisees want to operate close to where they reside, so to be able to show them available territories in their area is a valuable sales tool.
Once a prospect has selected a territory, show them visually why it is the best location to operate in.
Show them how their territory is within the remits of the franchise agreement.
UNDERSTAND YOUR TERRITORIES FASTER WITH FRANCHISE PLANNER.
Visualizing your territories on a map gives you a holistic view of them as well as the ability to balance and align your territories based on different values such as revenue potential.
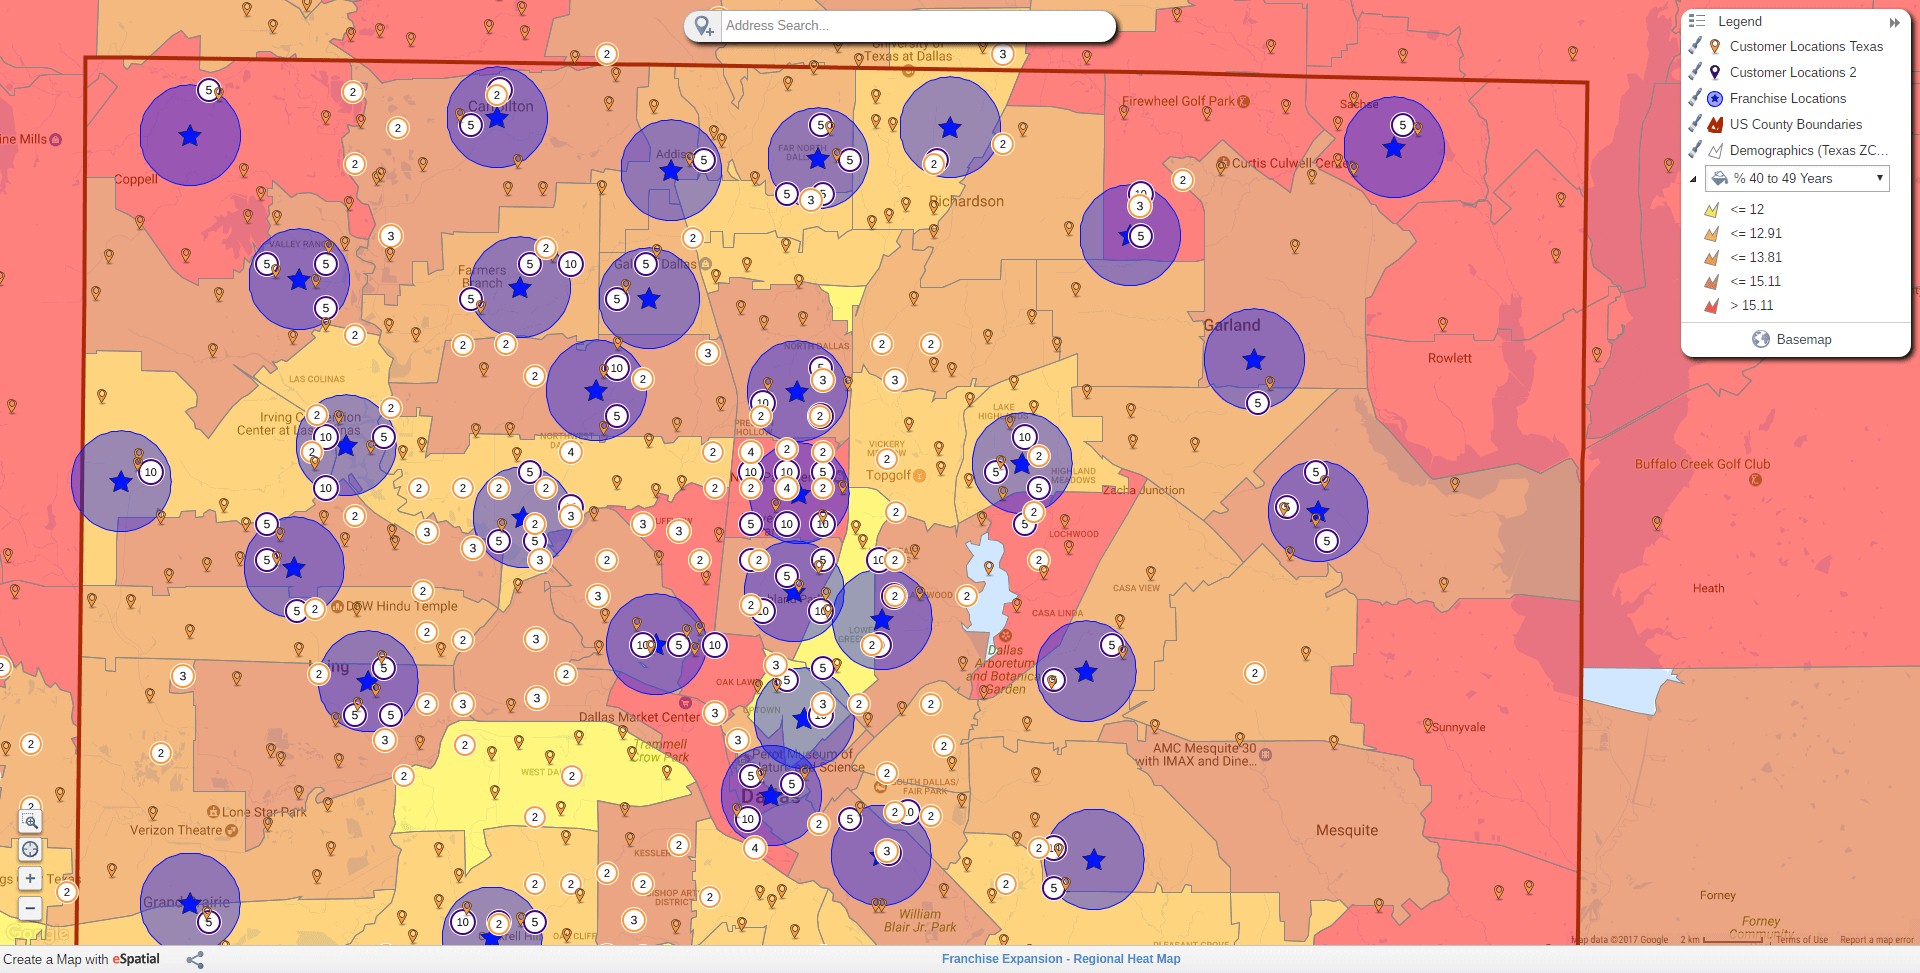
A regional heat map helps to quickly identify areas for further investigation by highlighting high and low performing areas.
Visually presenting the findings from analysis makes it easier for the receiver to absorb the information. This can be done with both static and live maps.
Solutions
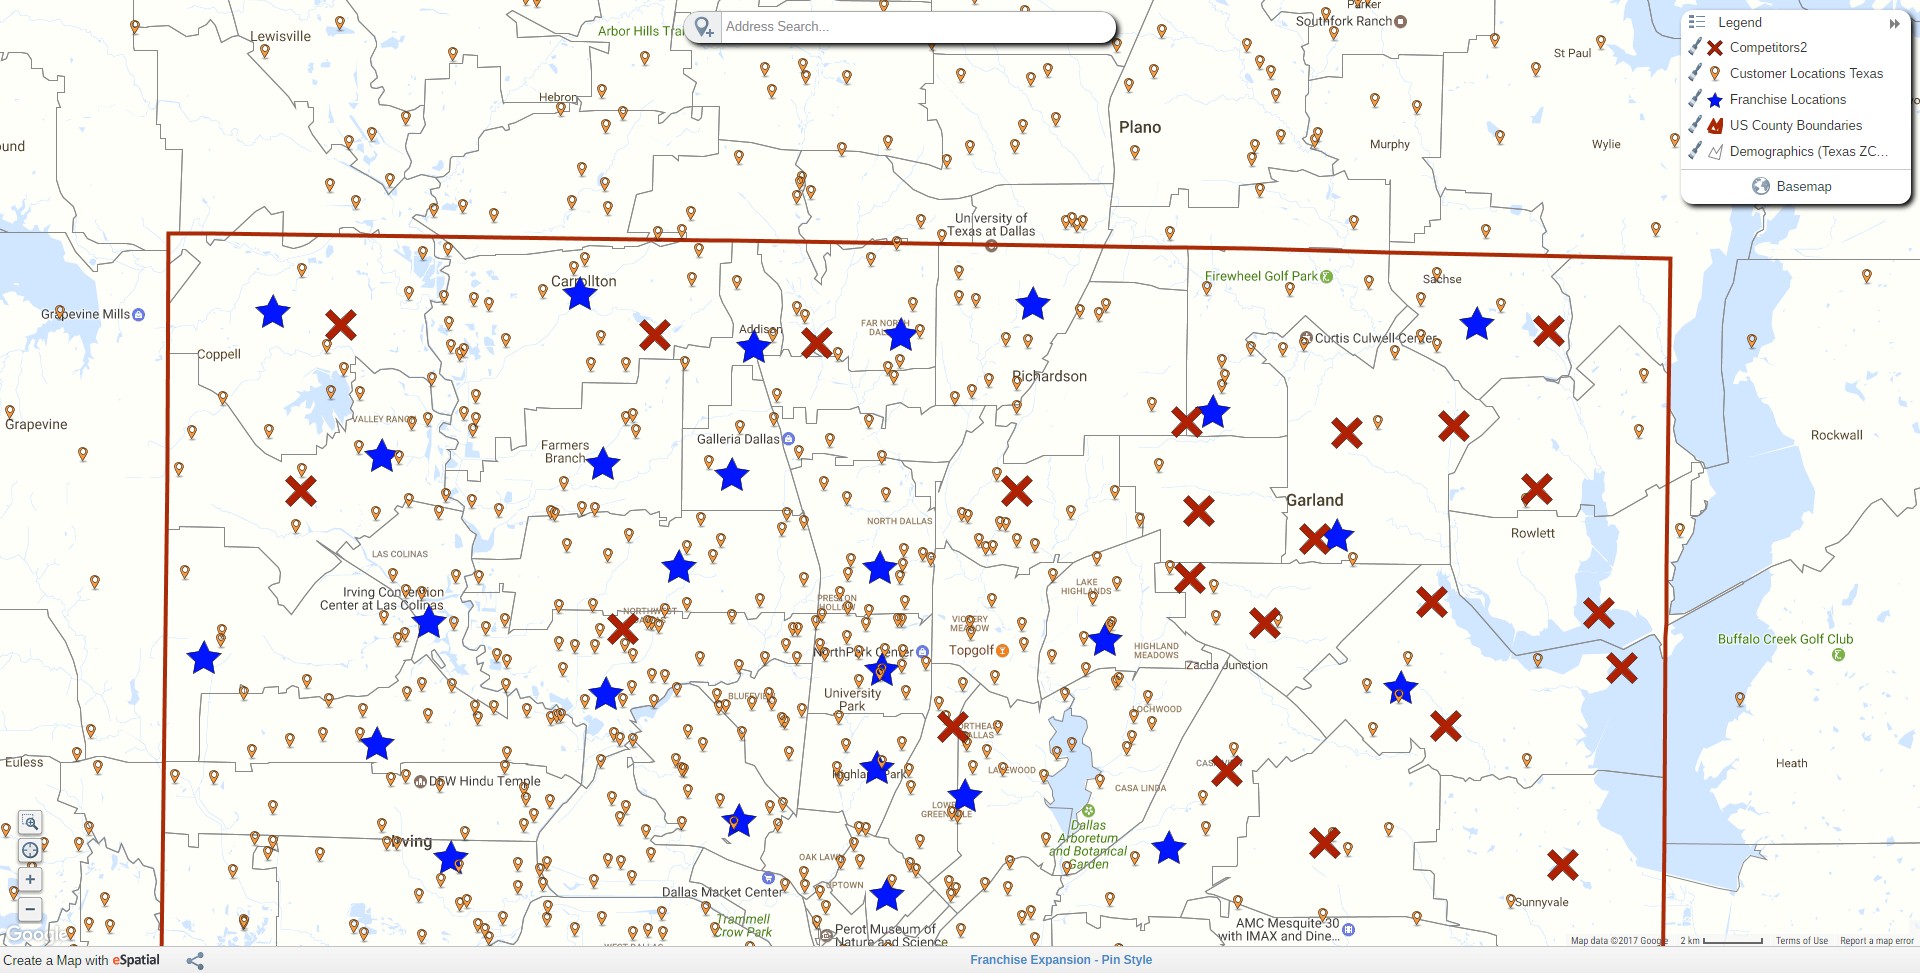
Styling Options
When you are dealing with multiple datasets, being able to differentiate them quickly and easily is key. With Hardcastle’s advance styling, you can use different icons, colors and sizes to enable the data to be quickly understood
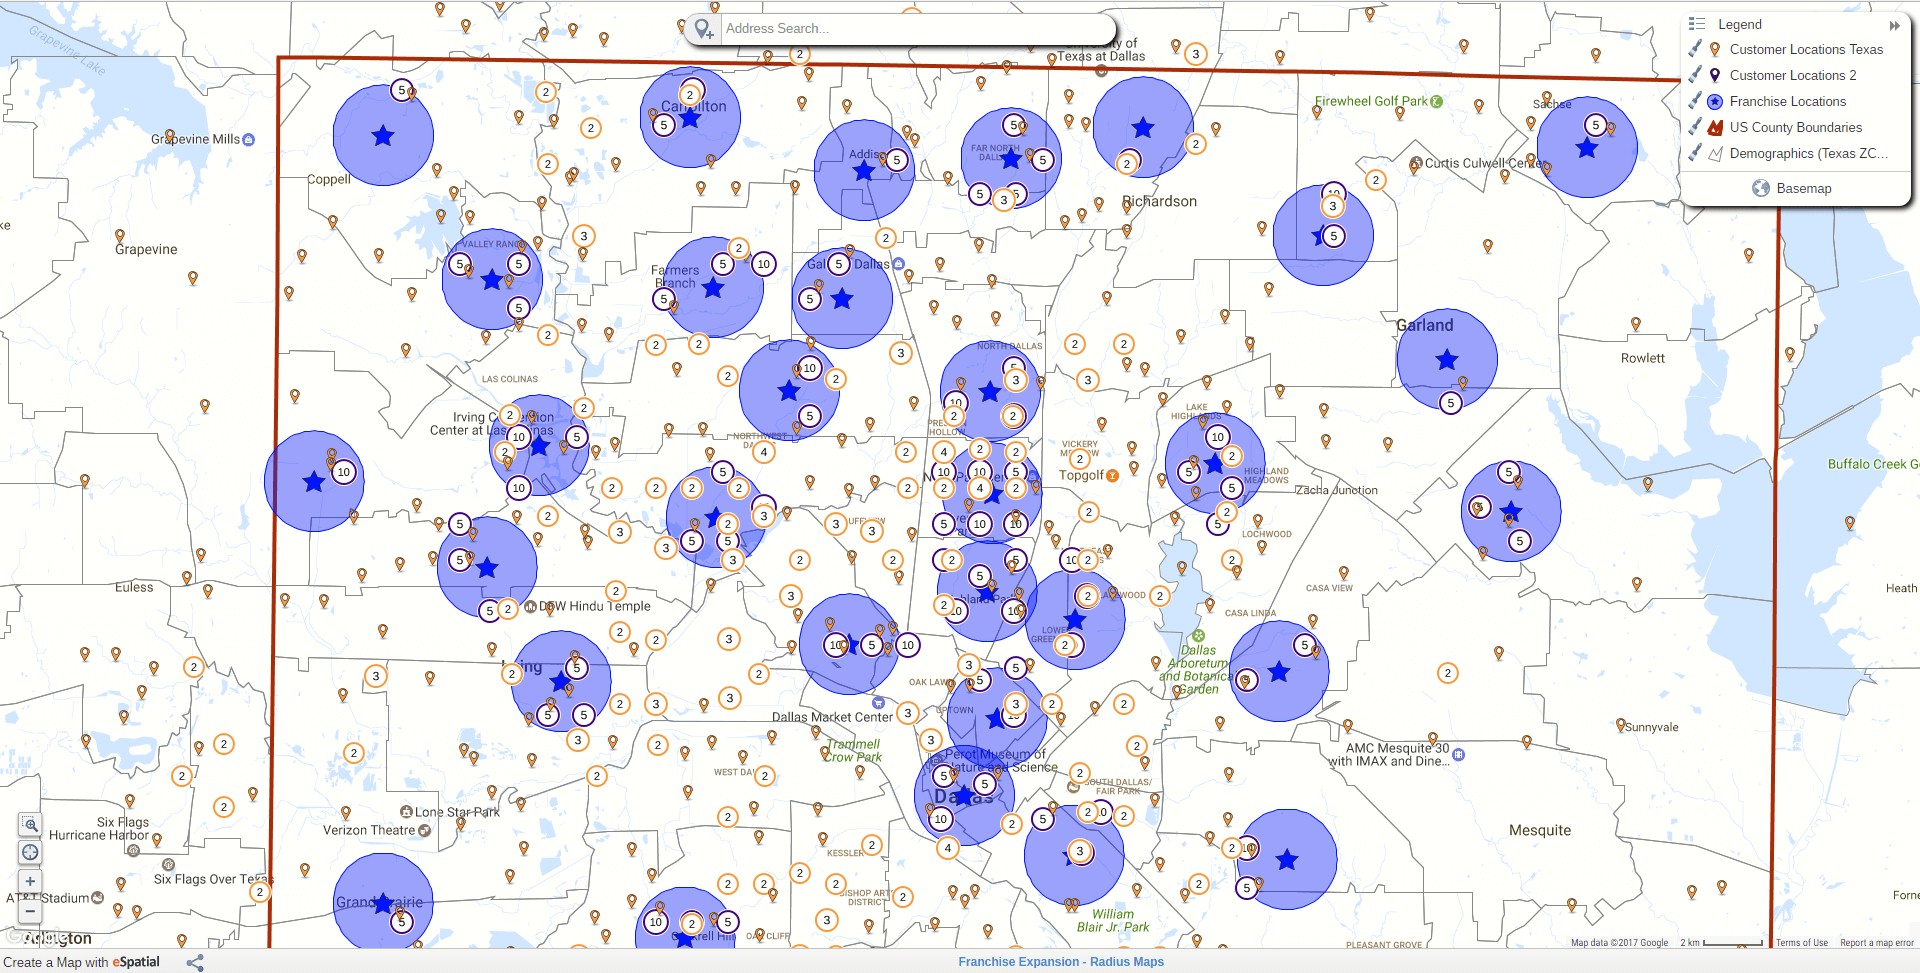
Radius Analysis
Radius maps, also known as buffer maps, are useful when you need to understand your data in relation to its proximity to other features. In franchise management, it is particularly useful as many franchise agreements state that no other franchise may be set up within a certain radius of an existing one.
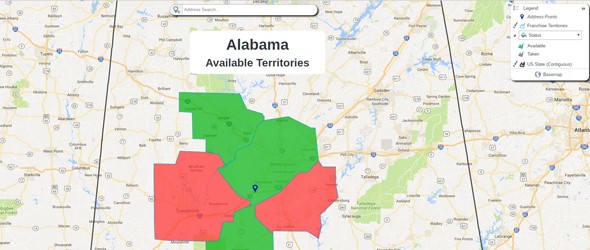
Territory Map
Visualize your territories geographically by creating them in our Territory Builder. You can build on ZIP, Country, or States. You can then color code them to show the status of the territory, whether it is available or not. The map to the left shows the franchise territories within a 20-mile radius of the prospective franchisees home. The colors represent whether the territory is
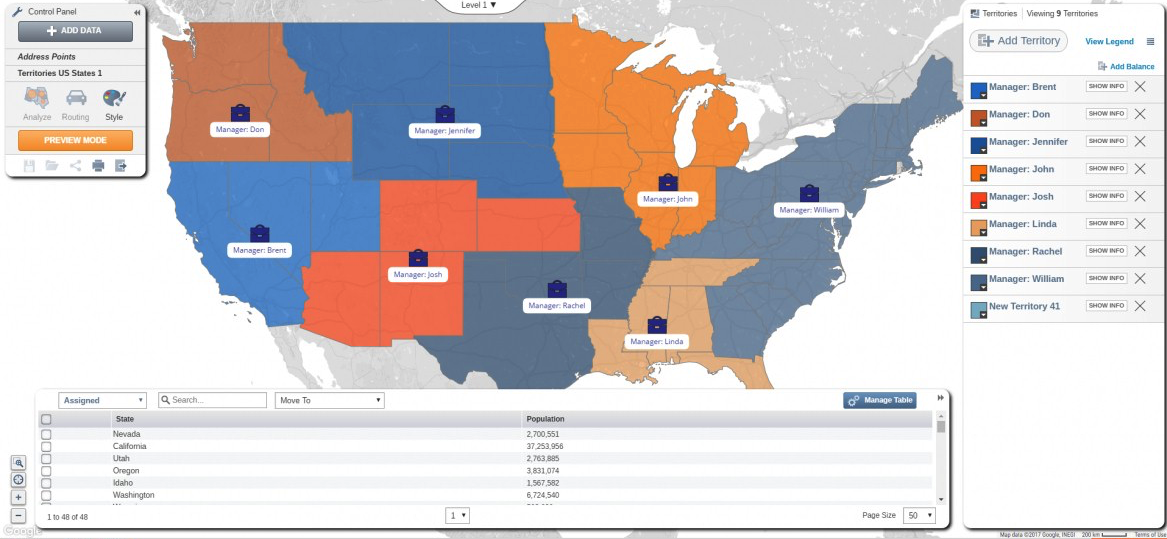
Territory Builder
The Territory Builder was used to create territories from the existing spreadsheet to providing a map view. The balancing feature was also used to identify territories that had become misaligned since they were designed over three years ago.
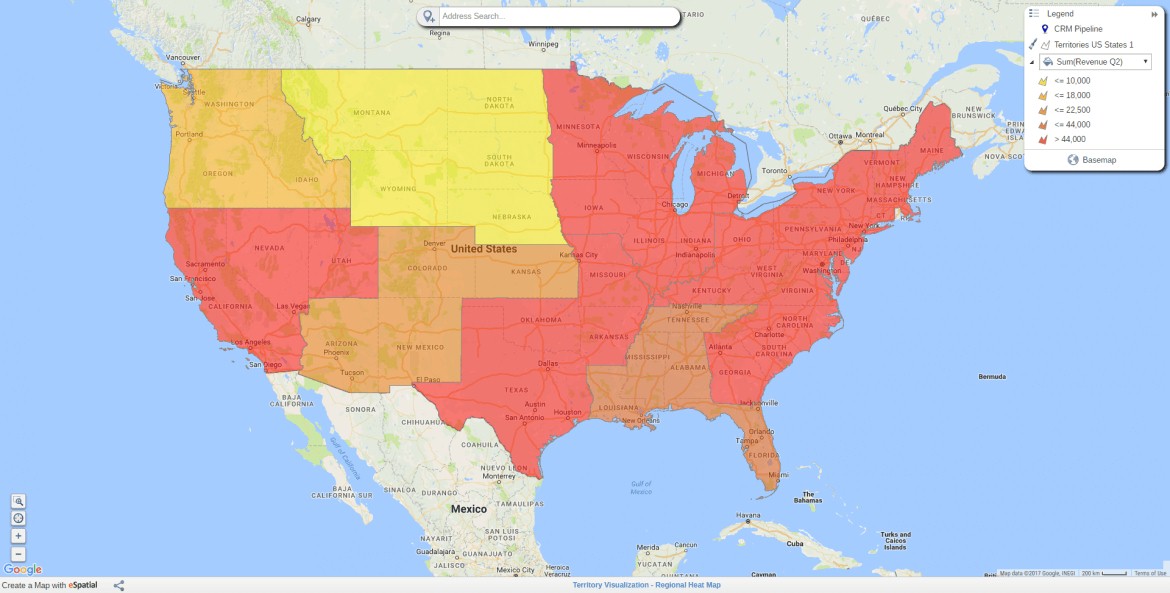
Regional Heat Maps
Regional Heat Maps were used to quickly compare sales performance across the territories built in the Territory Builder by overlaying said territories with sales and rep data from their CRM. This map highlighted gaps in rep coverage in addition to opportunities for expansion.
Map Exports
When it came to reporting the findings to key stakeholders, the Senior VP of Sales Operations exported the maps as JPEG files to use in his PowerPoint presentation. In addition to the map images, he included a secure link to the live map for the stakeholders to view at a later time.
Publish and Share Your Maps
When it came to presenting all of the above information to your prospective franchisees, you can do it in many ways. You can save the map as a JPEG to include in a power point presentation, you can export the map and tables to PDF or you can export the table data to Excel for further investigation. On top of all this, you can also share with them a link to a live interactive map allowing them to explore more locations.
Regional Heat maps
A regional heat map, which is a form of choropleth map, is one that uses graded differences in shading or color in order to indicate the aggregate or average values of some property or quantity in particular areas. Use it as a further analysis tool to identify areas with a high proportion of your target demographics.